sones GraphDB Visualization Tool

We want to show you something today: Not everybody has an idea what to think and do with a graph data structure. Not even talking about a whole graph database management system. In fact what everybody needs is something to get “in touch” with those kinds of data representations.

To make the graphs you are creating with the sones GraphDB that much more touchable we give you a sneak peak at our newest addition of the sone GraphDB toolset: the VisualGraph tool.

This tool connects to a running database and allows you to run queries on that database. The result of those queries is then presented to you in a much more natural and intuitive way, compared to the usual JSON and XML outputs. Even more: you can play with your queries and your data and see and feel what it’s like to work with a graph.

Expect this tool to be released in the next 1-2 months as open source. Everyone can use it, Everyone can benefit from it.

Oh. Almost forgot the video:


(Watch it in full screen if you can)

expect podcasts from sones :-)

Since sones will be at some community events, conferences and trade shows this year we thought it might be a good idea to have some hardware to document these events.

Since we wanted to have video and we did not want to cope with the rather complex subject of DSLRs we bought a full-hd-camcorder.

IMG_4669 Panasonic HDC-SD300

IMG_4672Touchscreen… hard to find anything without a Touchscreen these days.

developing a command line interface for the sones GraphDB

As you may know, my team and I are developing a graph database. A graph database is a database which is able to handle such things as the following:
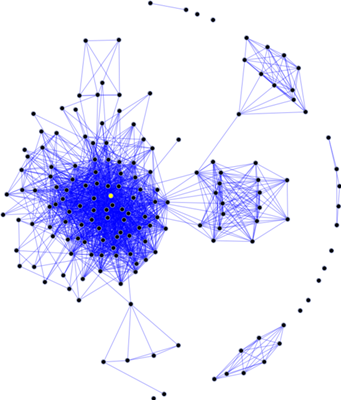
510px-Sna_largesocial graph

So instead of tables with rows and columns, a graph database concentrates on objects and the connections between them and is therefore forming a graph which can be queried, traversed, whatever-you-might-want-to-do.

Lately more and more companies start realizing that their demand for storing unstructured data is growing. Reflecting on unstructured data, I always think of data which cannot single-handedly be mapped in columns and rows (e.g. tables). Normally complex relations between data are represented in relation-tables only containing this relational information. The complexity to query these data structures is humongous as the table based database needs to ‘calculate’ (JOINs, …) the relations every time they are queried. Even though modern databases cache these calculations the costs in terms of memory and cpu time are huge.

Graph databases more or less try to represent this graph of objects and edges (as the relations are called there) as native as possible. The sones GraphDB we have been working on for the last 5 years does exactly that: It stores and queries a data structure which represents a graph of objects. Our approach is to give the user a simple and easy to learn query language and handle all the object storage and object management tasks in a fully blown object oriented graph database developed from the scratch.

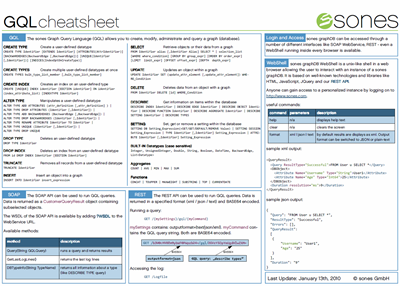
Since not everybody seems to have heard of graph databases, we thought it might be a good idea to lower barriers by providing personalized test instances. Everyone can get one of these without the need to install anything – a working AJAX/Javascript compatible browser will suit all needs. (get your instance here.)

Of course the user can choose between different ways to access the database test instance (like SOAP and REST) but the one we just released only needs a browser.
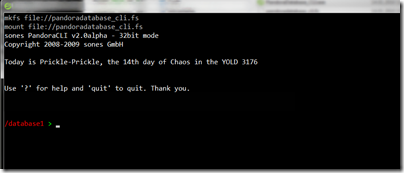
standard_cli

The sones GraphDB WebShell – as we call it – resembles a command line interface. The user can type a query and it is instantly executed on the database server and the results are presented in either a xml, json or text format.
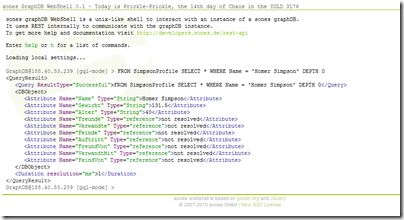
graphdb-webshell

Granted – the interested user needs to know about the query language and the possible usage scenarios. Everyone can access a long and a short documentation here.

Source 1: http://en.wikipedia.org/wiki/Social_graph
Source 2: http://www.sones.com
Source 3: Long documentation
Source 4: Short documentation


draw Sequence Diagrams by writing them on a website

Since we are developers we do need tools to note and draw what we think would solve the problems of this planet.

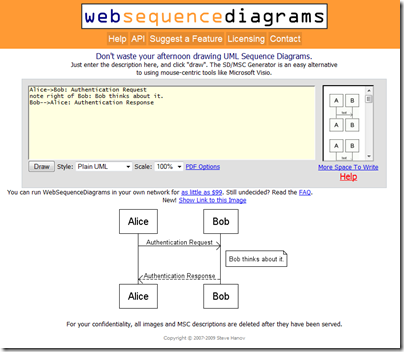
One way to draw a sequence of actions would be a sequence diagram. There are a nbumber of tools to draw them but now I came across a web service that would allow me to write my sequence diagram in a easy textual representation and then it draws the diagram for me. Great stuff!

webseqdiagram

Source 1: http://en.wikipedia.org/wiki/Sequence_diagram
Source 2: http://websequencediagrams.com/

Turning Linux ISO Images into bootable USB sticks

Today was Linux-Distribution-ISO-Install-Day. And it turned out that the only existing external DVD drive was fubar.

So what to do? We had a spare USB stick and it turns out that you can quite easily convert that USB stick into a bootable Linux-Distribution-Install-USB-Stick. Awesome!

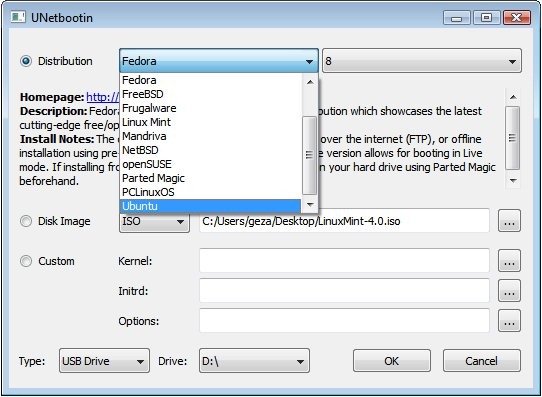
Just download the tool called “UNetbootin”, start it and you can turn virtually any ISO Distribution Image into an USB Stick that boots and installs that ISO:

 screenshot

Source: http://unetbootin.sourceforge.net/