Great overview of the possible .NET string formatting options:
Download here (or mirror)
Since we’re at it – we not only took the new Mono garbage collector through it’s paces regarding linear scaling but we also made some interesting measurements when it comes to query performance on the two .NET platform alternatives.
The same data was used as in the last article about the Mono GC. It’s basically a set of 200.000 nodes which hold between 15 to 25 edges to instances of another type of nodes. One INSERT operation means that the starting node and all edges + connected nodes are inserted at once.
We did not use any bulk loading optimizations – we just fed the sones GraphDB with the INSERT queries. We tested on two platforms – on Windows x64 we used the Microsoft .NET Framework and on Linux x64 we used a current Mono 2.7 build which soon will be replaced by the 2.8 release.
After the import was done we started the benchmarking runs. Every run was given a specified time to complete it’s job. The number of queries that were executed within this time window was logged. Each run utilized 10 simultaneously querying clients. Each client executed randomly generated queries with pre-specified complexity.
The Import
Not surprisingly both platforms are almost head-to-head in average import times. While Mono starts way faster than .NET the .NET platform is faster at the end with a larger dataset. We also measured the ram consumption on each platform and it turns out that while Mono takes 17 kbyte per complex insert operation on average the Microsoft .NET Framework only seems to take 11 kbyte per complex insert operation.
The Benchmark
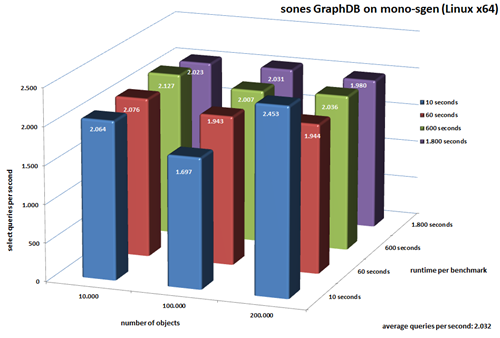
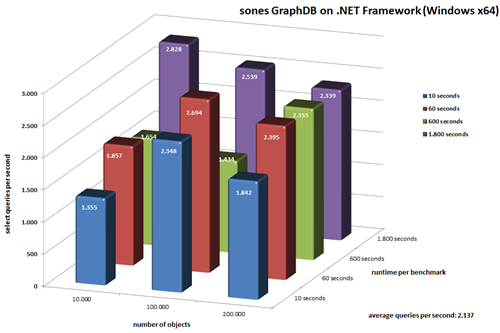
Let the charts speak for themselves first:
click to enlarge
click on the picture to enlarge
click on the picture to enlarge
As you can see on both platforms the sones GraphDB is able to work through more than 2.000 queries per second on average. For the longest running benchmark (1800 seconds) with all the data imported .NET allows us to answer 2.339 queries per second while Mono allows us to answer 1.980 queries per second.
The Conclusion
With the new generational garbage collector Mono surely made a great leap forward. It’s impressive to see the progress the Mono team was able to make in the last months regarding performance and memory consumption. We’re already considering Mono an important part of our platform strategy – this new garbage collector and benchmark results are showing us that it’s the right thing to do!
UPDATE: There was a mishap in the “import objects per second” row of the above table.
“Mono is a software platform designed to allow developers to easily create cross platform applications. It is an open source implementation of Microsoft’s .Net Framework based on the ECMA standards for C# and the Common Language Runtime. We feel that by embracing a successful, standardized software platform, we can lower the barriers to producing great applications for Linux.” (Source)
In other words: Mono is the platform which is needed to run the sones GraphDB on any operating system different from Windows. It included the so called “Mono Runtime” which basically is the place where the sones GraphDB “lives” to do it’s work.
Being a runtime is not an easy task. In fact it’s abilities and algorithms take a deep impact on the performance of the application that runs on top of it. When it comes to all things related to memory management the garbage collector is one of the most important parts of the runtime:
“In computer science, garbage collection (GC) is a form of automatic memory management. It is a special case of resource management, in which the limited resource being managed is memory. The garbage collector, or just collector, attempts to reclaim garbage, or memory occupied by objects that are no longer in use by the program. Garbage collection was invented by John McCarthy around 1959 to solve problems in Lisp.” (Source)
The Mono runtime has always used a simple garbage collector implementation called “Boehm-Demers-Weiser conservative garbage collector”. This implementation is mainly known for its simplicity. But as more and more data intensive applications, like the sones GraphDB, started to appear this type of garbage collector wasn’t quite up to the job.
So the Mono team started the development on a Simple Generational Garbage collector whose properties are:
To fully understand what this new garbage collector does you most probably need to read this and take a look inside the mono s-gen garbage collector code.
So what we did was taking the old and the new garbage collector and our GraphDB and let them iterate through an automated test which basically runs 200.000 insert queries which result in more than 3.4 million edges between more than 120.000 objects. The results were impressive when we compared the old mono garbage collector to the new mono-sgen garbage collector.
When we plotted a basic graph of the measurements we got that:
On the x-axis it’s the number of inserts and on the y-axis it’s the time it takes to answer one query. So it’s a great measurement to see how big actually the impact of the garbage collector is on a complex application like the sones GraphDB.
The red curve is the old Boehm-Demers-Weiser conservative garbage collector built into current stable versions of mono. The blue curve is the new SGEN garbage collector which can be used by invoking Mono using the “mono-sgen” command instead of the “mono” command. Since mono-sgen is not included in any stable build yet it’s necessary to build mono from source. We documented how to do that here.
So what are we actually seeing in the chart? We can see that mono-sgen draws a fairly linear line in comparison to the old mono garbage collector. It’s easy to tell why the blue curve is rising – it’s because the number of objects is growing with each millisecond. The blue line is just what we are expecting from a hard working garbage collector. To our surprise the old garbage collector seems to have problems to cope with the number of objects over time. It spikes several times and in the end it even gets worse by spiking all over the place. That’s what we don’t want to see happening anywhere.
The conclusion is that if you are running something that does more than printing out “Hello World” on Mono you surely want to take a look at the new mono-sgen garbage collector. If you’re planning to run the sones GraphDB on Mono we highly recommend to use mono-sgen.
It’s about time to import some data into our previously established object scheme. If you want to do this yourself you want to first run the Crunchbase mirroring tool and create your own mirror on your hard disk.
In the next step another small tool needs to be written. A tool that creates nice clean GQL import scripts for our data. Since every data source is different there’s not really a way around this step – in the end you’ll need to extract data here and import data here. One possible different solution could be to implement a dedicated importer for the GraphDB – but I’ll leave that for another article series. Back to our tool: It’s called “First-Import” and it’s only purpose is to create a first small graph out of the mirrored Crunchbase data and fill the mainly primitive data attributes. Download this tool here.
This is why in this first step we mainly focus on the following object types:
Additionally all edges to a company object and the competition will be imported in this part of the article series.
So what does the first-import tool do? Simple:
For the most part of the work it’s copy-n-paste to get the first-import tool together – it could have been done in a more sophisticated way (like using reflection on the deserialized JSON objects) but that’s most probably part of another article.
When run in the “crunchbase” directory created by the Crunchbase Mirroring tool the first-import tool generates GQL scripts – 6 of them to be precise:
The last script is named “Step_3” because it’s supposed to come after all the others.
These scripts can be easily imported after establishing the object scheme. The thing is though – it won’t be that fast. Why is that? We’re creating several thousand nodes and the edges between them. To create such an edge the Query Language needs to identify the node the edge originates and the node the edge should point to. To find these nodes the user is free to specify matching criteria just like in a WHERE clause.
So if you do a UPDATE Company SET (ADD TO Competitions SETOF(Permalink=’company1’,Permalink=’company2’)) WHERE Permalink = ’companyname’ the GraphDB needs to access the node identified by the Permalink Attribute with the value “companyname” and the two nodes with the values “company1” and “company2” to create the two edges. It will work just like all the scripts are but it won’t be as fast as it could be. What can help to speed up things are indices. Indices are used by the GraphDB to identify and find specific objects. These indices are used mainly in the evaluation of a WHERE clause.
The sones GraphDB offers a number of integrated indices, one of which is HASHTABLE which we are going to use in this example. Furthermore everyone interested can implement it’s own index plugin – we will have a tutorial how to do that online in the future – if you’re interested now just ask how we can help you to make it happen!
Back to the indices in our example:
The syntax of creating an index is quite easy, the only thing you have to do is tell the CREATE INDEX query on which type and attribute the index should be created and of which indextype the index should be. Since we’re using the Permalink attribute of the Crunchbase objects as an identifier in the example (it could be any other attribute or group of attributes that identify one particular object) we want to create indices on the Permalink attribute for the full speed-up. This would look like this:
Looks easy, is easy! To take advantage of course this index creation should be done before creating the first nodes and edges.
After we got that sorted the only thing that’s left is to run the scripts. This will, depending on your machine, take a minute or two.
So after running those scripts what happened is: all Company, FinancialOrganization, Person, ServiceProvider and Product objects are created and filled with primitive data types
That’s it for this part – in the next part of the series we will dive deeper into connecting nodes with edges. There is a ton of things that can be done with the data – stay tuned for the next part.
After the overview and the first use-case introduction it’s about time to play with some data objects.
So how can one actually access the data of crunchbase? Easy as pie: Crunchbase offers an easy to use interface to get all information out of their database in a fairly structured JSON format. So what we did is to write a tool that actually downloads all the available data to a local machine so we can play with it as we like in the following steps.
This small tool is called MirrorCrunchbase and can be downloaded in binary and sourcecode here. As for all sourcecode and tools in this series this runs on windows and linux (mono). You can use the sourcecode to get an impression what’s going on there or just the included binaries (in bin/Debug) to mirror the data of Crunchbase.
To say a few words about what the MirrorCrunchbase tool actually does first a small source code excerpt:
So first it gets the list of all objects like the company names and then it retrieves each company object according to it’s name and stores everything in .js files. Easy eh?
When it’s running you get an output similar to that:
And after the successful completion you should end up with a directory structure
The .js files store basically every information according to the data scheme overview picture of part 2. So what we want to do now is to transform this overview into a GQL data scheme we can start to work with. A main concept of sones GraphDB is to allow the user to evolve a data scheme over time. That way the user does not have to have the final data scheme before the first create statement. Instead the user can start with a basic data scheme representing only standard data types and add complex user defined types as migration goes along. That’s a fundamentally different approach from what database administrators and users are used to today.
Todays user generated data evolves and grows and it’s not possible to foresee in which way attributes need to be added, removed, renamed. Maybe the scheme changes completely. Everytime the necessity emerged to change anything on a established and populated data scheme it was about time to start a complex and costly migration process. To substantially reduce or even in some cases eliminate the need for such a complex process is a design goal of the sones GraphDB.
In the Crunchbase use-case this results in a fairly straight-forward process to establish and fill the data scheme. First we create all types with their correct name and add only those attributes which can be filled from the start – like primitives or direct references. All Lists and Sets of Edges can be added later on.
So these would be the Create-Type Statements to start with in this use-case:
You can directly download the according GQL script here. If you use the sonesExample application from our open source distribution you can create a subfolder “scripts” in the binary directory and put the downloaded script file there. When you’re using the integrated WebShell, which is by default launched on port 9975 an can be accessed by browsing to http://localhost:9975/WebShell you can execute the script using the command “execdbscript” followed by the filename of the script.
As you can see it’s quite straight forward a copy-paste action from the graphical scheme. Even references are not represented by a difficult relational helper, instead if you want to reference a company object you can just do that (we actually did that – look for example at the last line of the gql script above). As a result when you execute the above script you get all the Types necessary to fill data in in the next step.
So that’s it for this part – in the next part of this series we will start the initial data import using a small tool which reads the mirrored data and outputs gql insert queries.
This series already tells in it’s name what the use case is: The “CrunchBase”. On their website they speak for themselves to explain what it is: “CrunchBase is the free database of technology companies, people, and investors that anyone can edit.”. There are many reasons why this was chosen as a use-case. One important reason is that all data behind the CrunchBase service is licensed under Creative-Commons-Attribution (CC-BY) license. So it’s freely available data of high-tech companies, people and investors.
Currently there are more than 40.000 different companies, 51.000 different people and 4.200 different investors in the database. The flood of information is big and the scale of connectivity even bigger. The graph represented by the nodes could be even bigger than that but because of the limiting factors of current relational database technology it’s not feasible to try to do that.
sones GraphDB is coming to the rescue: because it’s optimized to handle huge datasets of strongly connected data. Since the CrunchBase data could be uses as a starting point to drive connectivity to even greater detail it’s a great use-case to show these migration and handling.
Thankfully the developers at CrunchBase already made one or two steps into an object oriented world by offering an API which answers queries in JSON format. By using this API everyone can access the complete data set in a very structured way. That’s both good and bad. Because the used technologies don’t offer a way to represent linked objects they had to use what we call “relational helpers”. For example: A person founded a company. (person and company being a JSON object). There’s no standardized way to model a relationship between those two. So what the CrunchBase developers did is they added an unique-Identifier to each object. And they added a new object which is uses as a “relational helper”-object. The only purpose of these helper objects is to point towards a unique-identifier of another object type. So in our example the relationship attribute of the person object is not pointing directly to a specific company or relationship, but it’s pointing to the helper object which stores the information which unique-identifier of which object type is meant by that link.
To visualize this here’s the data scheme behind the CrunchBase (+all currently available links):
As you can see there are many more “relational helper” dead-ends in the scheme. What an application had to do up until now is to resolve these dead-ends by going the extra mile. So instead of retrieving a person and all relationships, and with them all data that one would expect, the application has to split the data into many queries to internally build a structure which essentially is a graph.
Another example would be the company object. Like the name implies all data of a company is stored there. It holds an attribute called investments which isn’t a primitive data type (like a number or text) but a user defined complex data type. This user defined data type is called List<FundingRoundStructure>. So it’s a simple list of FundingRoundStructure objects.
When we take a look at the FundingRoundStructure there’s an attribute called company which is made up by the user defined data type CompanyStructure. This CompanyStructure is one of these dead-ends because there’s just a name and a unique-id. The application now needs retrieve the right company object with this unique-id to access the company information.
Simple things told in a simple way: No matter where you start, you always will end up in a dead-end which will force you to start over with the information you found in that dead-end. It’s not user-friendly nor easy to implement.
The good news is that there is a way to handle this type of data and links between data in a very easy way. The sones GraphDB provides a rich set of features to make the life of developers and users easier. In that context: If we would like to know which companies also received funding from the same investor like let’s say the company “facebook” the only thing necessary would be one short query. Beside that those “relational helpers” are redundant information. That means in a graph database this information would be stored in the form of edges but not in any helper objects.
The reason why the developers of CrunchBase had to use these helpers is that JSON and the relational table behind it isn’t able to directly store this information or to query it directly. To learn more about those relational tables and databases try this link.
I want to end this part of the series with a picture of the above relational diagram (without the arrows and connections).
The next part of the series will show how we can access the available information and how a graph scheme starts to evolve.
If you want to explain how easy it is for a user or developer to use the sones GraphDB to work on existing datasets you do that by showing him an example – a use case. And this is exactly what this short series of articles will do: It’ll show the important steps and concepts, technologies and designs behind the use case and the sones GraphDB.
The sones GraphDB is a DBMS focusing on strong connected unstructured and semi-structured data. As the name implies these data sets are organized in Nodes and Edges objectoriented in a graph data structure.
“a simple graph”
To handle these complex graph data structures the user is given a powerful toolset: the graph query language. It’s a lot like SQL when it comes to comprehensibility – but when it comes to functionality it’s completely designed to help the user do previously tricky or impossible things with one easy query.
This articles series is going to show how real conventional-relational data is aggregated and ported to an easy to understand and more flexible graph datastructure using the sones GraphDB. And because this is not only about telling but also about doing we will release all necessary tools and source codes along with this article. That means: This is a workshop and a use case in one awesome article series.
The requirements to follow all steps of this series are: You want to have a working sone GraphDB. Because we just released the OpenSource Edition Version 1.1 you should be fine following the documentation on how to download and install it here. Beside that you won’t need programming skills but if you got them you can dive deep into every aspect. Be our guest!
This first article is titled “Overview” and that’s what you’ll get:
part 1: Overview
part 2: A short introduction into the use-case and it’s relational data
part 3: Which data and how does a GQL data scheme start?
part 4: The initial data import
part 5: Linking nodes and edges: What’s connected with what and how does the scheme evolve?
part 6: Querying the data and how to access it from applications?
Well if you want just the essence of information that makes you go faster on your daily tasks cheat sheets are just that: the essence of information.
Today I found this cheat sheet particularly useful:
Source: http://zrusin.blogspot.com/2007/09/git-cheat-sheet.html
If you want to create a (mountable, bootable) image of your local hard disk just use that small and cool tool Disk4vhd
Source: http://technet.microsoft.com/en-us/sysinternals/ee656415.aspx
Every once in a while you download some code and fire up your Visual Studio and find out that this particular solution was once associated to a team foundation server you don’t know or have a login to. Like when you download source code from CodePlex and you get this “Please type in your username+password for this CodePlex Team Foundation Server”.
Or maybe you’re working on your companies team foundation server and you want to put some code out in the public. You surely want to get rid of these Team Foundation Server bindings.
There’s a fairly complicated way in Visual Studio to do this but since I was able to produce unforseen side effects I do not recommend it.
So what I did was looking into those files a Visual Studio Solution and Project consists of. And I found that there are really just a few files that hold those association information. As you can see in the picture below there are several files side by side to the .sln and .csproj files – like that .vssscc and .vspscc file. Even inside the .csproj and .sln file there are hints that lead to the team foundation server – so obviously besides removing some files a tool would have to edit some files to remove the tfs association.
So I wrote such a tool and I am going release it’s source code just beneath this article. Have fun with it. It compiles with Visual Studio and even Mono Xbuild – actually I wrote it with Monodevelop on Linux ;) Multi-platform galore! Who would have thought of that in the founding days of the .NET platform?
So this is easy – this small tool runs on command line and takes one parameter. This parameter is the path to a folder you want to traverse and remove all team foundation server associations in. So normally I take a check-out folder and run the tool on that folder and all its subfolders to remove all associations.
So if you want to have this cool tool you just have to click here: Sourcecode Download
So finally after years and years of hope and nerdy ideas I am able to hold a tablet device in my own hands and it’s not only as good as Picards tablet was back in that great “Star Trek: Next Generation” series, it’s better.
Of course I had to import that particular iPad from the U.S. (thanks Alex!) – actually it was the first time I imported something that expensive. Beside some fun with the shipping company everything went fine. Since Apple just announced to delay the launch of the iPad in Europe for a month it’s nice to have a gadget just a few weeks after it was available in the U.S.
Developing software is hard work – especially when you target several operating systems. One task that you have to perform quite often would be to deploy a new installation of an operating system as fast as possible on a test machine.
Doing this with Windows is easy – you can use the Windows Deployment Services to bootstrap Windows onto almost every machine which can boot over ethernet using PXE. Everything needed to make WDS work on a Windows Boot-Image is located on that image. Since it’s that easy I won’t dive into more detail here.
What I want to show in greater detail is how you can use WDS to deploy even Linux over your network.
Step 1: Get PXELINUX
What’s needed to boot Linux over a network is a dedicated PXE Boot Loader. This one is called PXELINUX and can be downloaded here.
“PXELINUX is a SYSLINUX derivative, for booting Linux off a network server, using a network ROM conforming to the Intel PXE (Pre-Execution Environment) specification.”
On the homepage of PXELINUX is also a short tutorial which files you need and where to copy them.
Step 2: Setup WDS with PXELINUX
I suppose you got your WDS Installation up and running and you are able to deploy Windows. If that’s the case you can go to your WDS Server Management Tool and right-click on the server name – in my case “fileserver.sones”. If you select “Properties” in the context menu you would see the properties windows like in the screenshot below:
You have to change the Boot-Loader from the standard Windows BootMgr to the newly downloaded PXELINUX bootloader. Since this bootloader comes with it’s own set of config files you can edit this config file to allow booting into Windows.
Step 3: Edit PXELINUX configuration file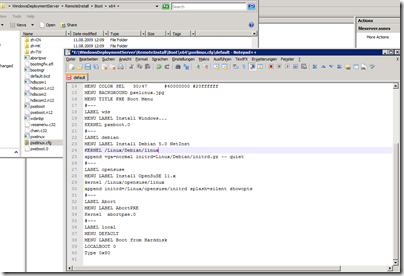
The first entry I made into the boot menu of the PXELINUX boot loader is the “Install Windows…” entry. Since the first thing the users will see after booting is the PXELINUX loader menu they need to be able to continue to their Windows Installation. Since this Windows Installation cannot be handled by the PXELINUX loader you have to define a boot menu entry which looks a lot like this:
LABEL wds
MENU LABEL Install Windows…
KERNEL pxeboot.0
To add OpenSuSE to the menu you would add an entry looking like this:
LABEL opensuse
MENU LABEL Install OpenSuSE 11.x
kernel /Linux/opensuse/linux
append initrd=/Linux/opensuse/initrd splash=silent showopts
The paths given in the above entry should be altered according to the paths you’re using in your installation. I took the /Linux/opensuse/ files from the network install dvd images of OpenSuSE.
That’s basically everything there is about the installation of Linux (Debian works accordingly) over PXE and WDS.
And finally this is what it should look like if everything worked great:
Source 1: http://en.wikipedia.org/wiki/Preboot_Execution_Environment
Source 2: http://syslinux.zytor.com/wiki/index.php/PXELINUX
Die CeBIT ist um und sones schliesst seinen Auftritt im Rahmen der Partnerschaft mit Microsoft mit einem durch und durch positiven Ergebnis ab.Ich selbst hatte ja aufgrund einer ungünstigen Terminsituation nur am Montag und am Freitag die Möglichkeit persönlich vor Ort zu sein.
Die CeBIT war dieses Jahr eine schöne Möglichkeit einmal im breiteren Rahmen als auf den sonst üblichen Konferenzen und Veranstaltungen zu netzwerken.
sones hatte die Gelegenheit zusammen mit anderen Partnerunternehmen am Microsoft Stand in Halle 4 auszustellen. Geniale Sache war das insofern dass wir sowohl am Stand als auch im Rahmen des MSDN Developer Kinos die Möglichkeit hatten unsere Technologie mit Demonstrationen und Worten vorzustellen.
Ich hatte ja schon darüber geschrieben dass wir eine Demo für die CeBIT auf Basis des Microsoft Surface Multi-Touch Tisches entwickelt haben. Das Feedback zu dieser Demo war durchweg extrem positiv. Es ist eben ein Unterschied für viele nicht-Techniker wenn man Ihnen einen Graph grafisch vor Augen führt und in diesem Graphen navigieren kann.
Für die Techniker auf der anderen Hand hat sich Henning nocheinmal hingesetzt und ein wenig weiter ausgeführt was hinter der Surface Demo steckt. Das kann man hier nachlesen.
Hier ein paar Impressionen:
Since there are still 9 days to go till SXSW 2010 it’s a pleasure to give out a link to the completely unofficial torrents which old all mp3 files of almost all songs which are to be presented at this years SXSW:
“The SXSW® Music and Media Conference showcases hundreds of musical acts from around the globe on over eighty stages in downtown Austin. By day, conference registrants do business in the SXSW® Trade Show in the Austin Convention Center and partake of a full agenda of informative, provocative panel discussions featuring hundreds of speakers of international stature.”
Source 1: http://www.sxsw.com/music
Source 2: http://sites.google.com/site/sxswtorrent/2010
Oh what a nice n3rd toy this would be. Rumors say it will be available soon for under $30. And for those who right now think: “What the hell is this?” – This is a coffee mug in the shape of a quite expensive canon lens. In fact I already heard of that idea more than a year ago and wrote about it here. At this time there were only hopes that it would be produced.
Source: http://www.petapixel.com/2010/03/06/canon-lens-mug-purchased-in-canada/
At sones I am involved in a project that works with a piece of hardware I wanted to work with for about 3 years now: the Microsoft Surface Table.
I was able to play with some tables every now and then but I never had a “business case” which contained a Surface. Now that case just came to us: sones is at the CeBIT fair this year – we were invited by Microsoft Germany to join them and present our cool technology along with theirs.
Since we already had a graph visualisation tool the idea was to bring that tool to Surface and use the platform specific touch controls and gestures.
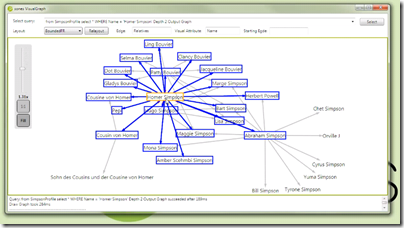
the VisualGraph application that gave the initial idea
The good news was that it’s easier than thought to develop an application for Surface and all parties are highly committed to the project. The bad news is that we were short on time right from the start: less than 10 days from concept to live presentation isn’t the definition of “comfortable time schedule”. And since we’re currently in the process of development it’s a continueing race.
Thankfully Microsoft is committed to a degree they even made it possible to have two great Surface and WPF ninjas who enable is to get up to speed with the project (thanks to Frank Fischer, Andrea Kohlbauer-Hug, Rainer Nasch and Denis Bauer, you guys rock!).
I was able to convice UID to jump in and contribute their designing and user interface knowledge to our little project (thanks to Franz Koller and Cristian Acevedo).
During the process of development I made some pictures which will be used here and there promoting the demonstration. To give you an idea of the progress we made here’s a before and after picture:
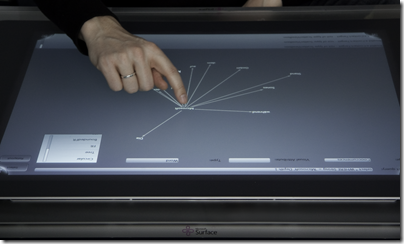
We started with a simple port of VisualGraph to the surface table…
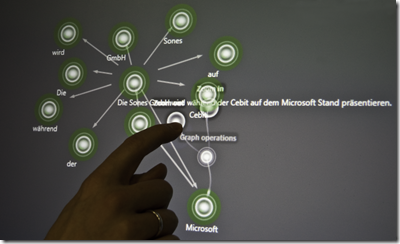
…and had something better working and looking at the end of that day.
I think everyone did a great job so far and will continue to do so – a lot work to be done till CeBIT! :-)
Source 1: http://www.sones.com
Source 2: http://www.microsoft.de
Source 3: http://www.uid.com/
We want to show you something today: Not everybody has an idea what to think and do with a graph data structure. Not even talking about a whole graph database management system. In fact what everybody needs is something to get “in touch” with those kinds of data representations.
To make the graphs you are creating with the sones GraphDB that much more touchable we give you a sneak peak at our newest addition of the sone GraphDB toolset: the VisualGraph tool.
This tool connects to a running database and allows you to run queries on that database. The result of those queries is then presented to you in a much more natural and intuitive way, compared to the usual JSON and XML outputs. Even more: you can play with your queries and your data and see and feel what it’s like to work with a graph.
Expect this tool to be released in the next 1-2 months as open source. Everyone can use it, Everyone can benefit from it.
Oh. Almost forgot the video:
(Watch it in full screen if you can)
Since sones will be at some community events, conferences and trade shows this year we thought it might be a good idea to have some hardware to document these events.
Since we wanted to have video and we did not want to cope with the rather complex subject of DSLRs we bought a full-hd-camcorder.
 Touchscreen… hard to find anything without a Touchscreen these days.
As you may know, my team and I are developing a graph database. A graph database is a database which is able to handle such things as the following:
So instead of tables with rows and columns, a graph database concentrates on objects and the connections between them and is therefore forming a graph which can be queried, traversed, whatever-you-might-want-to-do.
Lately more and more companies start realizing that their demand for storing unstructured data is growing. Reflecting on unstructured data, I always think of data which cannot single-handedly be mapped in columns and rows (e.g. tables). Normally complex relations between data are represented in relation-tables only containing this relational information. The complexity to query these data structures is humongous as the table based database needs to ‘calculate’ (JOINs, …) the relations every time they are queried. Even though modern databases cache these calculations the costs in terms of memory and cpu time are huge.
Graph databases more or less try to represent this graph of objects and edges (as the relations are called there) as native as possible. The sones GraphDB we have been working on for the last 5 years does exactly that: It stores and queries a data structure which represents a graph of objects. Our approach is to give the user a simple and easy to learn query language and handle all the object storage and object management tasks in a fully blown object oriented graph database developed from the scratch.
Since not everybody seems to have heard of graph databases, we thought it might be a good idea to lower barriers by providing personalized test instances. Everyone can get one of these without the need to install anything – a working AJAX/Javascript compatible browser will suit all needs. (get your instance here.)
Of course the user can choose between different ways to access the database test instance (like SOAP and REST) but the one we just released only needs a browser.
The sones GraphDB WebShell – as we call it – resembles a command line interface. The user can type a query and it is instantly executed on the database server and the results are presented in either a xml, json or text format.
Granted – the interested user needs to know about the query language and the possible usage scenarios. Everyone can access a long and a short documentation here.
Source 1: http://en.wikipedia.org/wiki/Social_graph
Source 2: http://www.sones.com
Source 3: Long documentation
Source 4: Short documentation
Since we all need documentation I thought it would be a great idea to create a one-pager which helps every user to remember important things like query language syntax.
You can download the cheatsheet here:
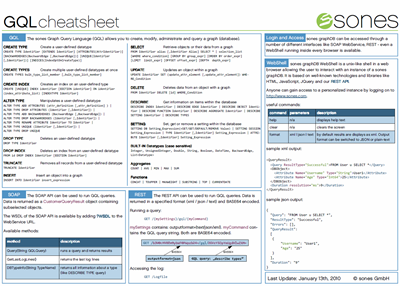
Download here.
Since we are developers we do need tools to note and draw what we think would solve the problems of this planet.
One way to draw a sequence of actions would be a sequence diagram. There are a nbumber of tools to draw them but now I came across a web service that would allow me to write my sequence diagram in a easy textual representation and then it draws the diagram for me. Great stuff!
Source 1: http://en.wikipedia.org/wiki/Sequence_diagram
Source 2: http://websequencediagrams.com/
Today was Linux-Distribution-ISO-Install-Day. And it turned out that the only existing external DVD drive was fubar.
So what to do? We had a spare USB stick and it turns out that you can quite easily convert that USB stick into a bootable Linux-Distribution-Install-USB-Stick. Awesome!
Just download the tool called “UNetbootin”, start it and you can turn virtually any ISO Distribution Image into an USB Stick that boots and installs that ISO: