Browsers can do many things. It’s probably your main window into the vast internet. Lots of things need visualization. And if you want to know how it’s done, maybe do one yourself, then…
D3.js is a JavaScript library for manipulating documents based on data. D3 helps you bring data to life using HTML, SVG, and CSS. D3’s emphasis on web standards gives you the full capabilities of modern browsers without tying yourself to a proprietary framework, combining powerful visualization components and a data-driven approach to DOM manipulation.
D3.js
And to further learn what it’s all about, go to Amelia Wattenbergers blog and take a stroll:
So, you want to create amazing data visualizations on the web and you keep hearing about D3.js. But what is D3.js, and how can you learn it? Let’s start with the question: What is D3?
An Introduction to D3.js
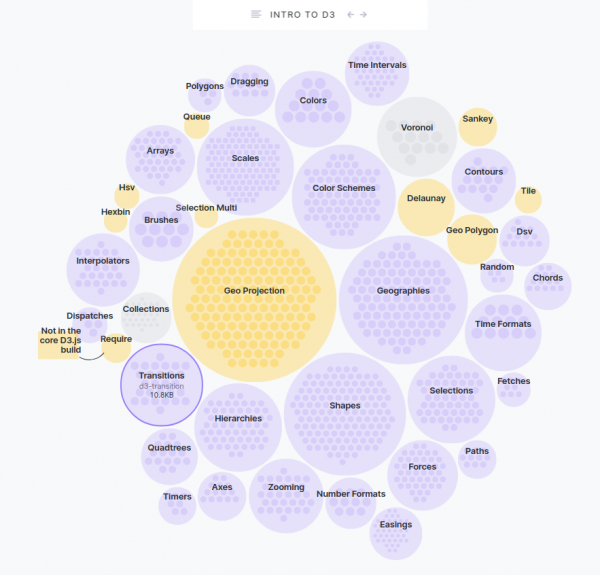
While it might seem like D3.js is an all-encompassing framework, it’s really just a collection of small modules. Here are all of the modules: each is visualized as a circle – larger circles are modules with larger file sizes.

